Updated 2026-08-18
AI visibility metrics across ChatGPT, Gemini, and Perplexity
Do not compress AI visibility into one magic score. Use mention rate to measure presence, citation rate to measure whether your site is used as a source, share of voice to measure competitive position, and sentiment to measure how you are framed. Keep the prompt set and denominator stable, compare ChatGPT, Gemini, and Perplexity against their own histories, then open the answers behind any meaningful change.
AI visibility dashboards make weak decisions look precise. A percentage can rise because your brand became more visible, because you added easy branded prompts, because one platform failed fewer checks, or because the competitor set changed. The number alone cannot tell you which happened.
The useful unit is not a score. It is an observed answer to one buyer prompt, on one AI platform, at one point in time. The metrics below are different rollups of those answer-level observations — and together they are the scoreboard for the whole LLM SEO loop.
To connect answer visibility with measurable visits and outcomes, use the GA4 guide to AI referral traffic. Keep citation evidence and session attribution separate.
Start with the measurement unit
Suppose you monitor 10 prompts on ChatGPT, Gemini, and Perplexity. One scheduled run can produce up to 30 answer checks: 10 prompts × 3 platforms. For each qualified answer, you can ask four separate questions:
- Did the answer mention the brand?
- Did it link the brand's domain as a source?
- Which configured competitors also appeared?
- If the brand appeared, was the framing positive, neutral, or negative?
That distinction matters because a single answer can mention your brand without citing your site, cite your site without recommending your brand, mention three competitors, or describe you negatively.
AEO Mantis excludes direct-brand prompts and bare competitor prompts from overall visibility metrics by default. A question such as “What is Acme?” is useful for checking brand accuracy, but it is too easy to inflate discovery visibility. The default scoreboard focuses on category discovery, comparisons, and other prompts where the answer is not guaranteed to discuss you.
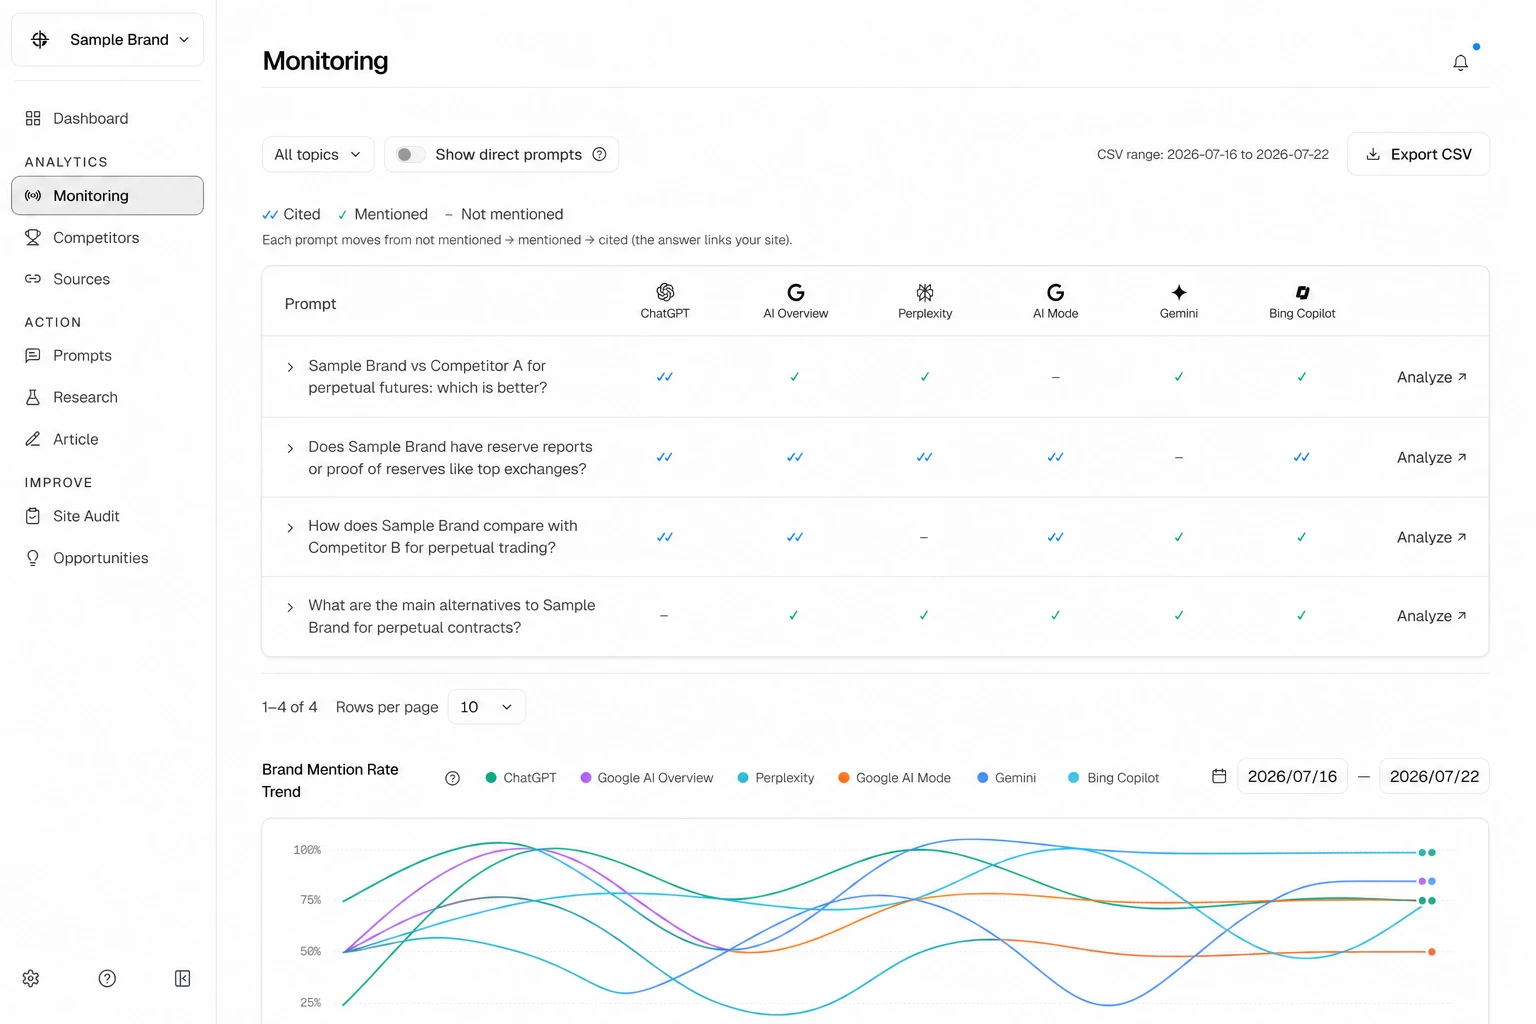
What to track on ChatGPT, Gemini, and Perplexity
The four metrics stay the same across platforms, but citation behavior does not. Record the visible answer first; do not assume that one platform's sourcing pattern applies to another.
- ChatGPT Search: answers can show inline citations and a Sources panel. OpenAI also says a prompt may be rewritten into more targeted searches. Record brand mention and domain citation separately; save the visible sources rather than treating a mention as proof that your page was used.
- Gemini: source links may appear inline or under a Sources button, but Google notes that not every response includes links. A response without links is still a valid citation-free observation. Compare Gemini with Gemini over the same prompt set.
- Perplexity: Perplexity says every response includes citations and links to original sources. Separate brand mention, domain citation, and source position. Keep the same search mode and model when comparing runs.
Interfaces change, so preserve the captured answer and source list as the evidence behind the metric.
1. Mention rate measures presence
Mention rate = qualified answers that mention your brand ÷ qualified answers checked.
If your brand appears in 6 of 20 qualified answers, the mention rate is 30%. In AEO Mantis, the overall figure is the average of the per-platform rates, so each monitored platform has equal weight. Always open the platform breakdown before interpreting the aggregate.
Mention rate answers: “How often do we enter the answer at all?” It does not tell you whether you were recommended, cited, ranked first, or described favorably.
Read it in layers:
- Low across every platform: you may have a category-association, authority, entity-consistency, or prompt-fit problem.
- Healthy on one platform and weak on another: the gap is platform-specific; inspect the sources and wording used by each answer.
- Healthy overall but weak in a high-intent topic: the aggregate is hiding a commercially important gap.
- High only when the prompt names you: the prompt set is flattering the brand rather than measuring discovery.
The best next action comes from the missing topic or platform, not from the overall percentage.
2. Citation rate measures source use
Citation rate = qualified answers that link your domain ÷ qualified answers checked.
If your domain appears in the sources for 4 of 20 answers, your citation rate is 20%. This is stricter than a mention: the engine did not merely name you; it used or attributed information to a page on your site.
Citation rate answers: “How often does our own content earn a source slot?” It is the most useful metric for content and technical teams because every lost citation can be investigated at the page and prompt level.
Do not treat it as a popularity score. A citation can support a generic fact while a competitor receives the recommendation. Conversely, an answer can recommend your brand using third-party sources and never link your domain.
The mention–citation combination is more diagnostic than either rate alone:
- High mentions, low citations: AI systems know the brand, but your site is not often used as the evidence. Inspect crawlability, answer-first structure, source quality, and whether the relevant claim exists on a stable URL.
- Low mentions, healthy citations: your pages are useful sources, but the brand is not entering the shortlist. Strengthen the connection between your evidence, products, category, and brand entity.
- Both low: fix measurement and foundations before chasing marginal optimizations.
- Both rising: verify that the gain occurs on buyer prompts, not only low-value informational questions.
For the content-side work, use the rules in How to Write Content That AI Engines Actually Cite.
3. Share of voice measures competitive position
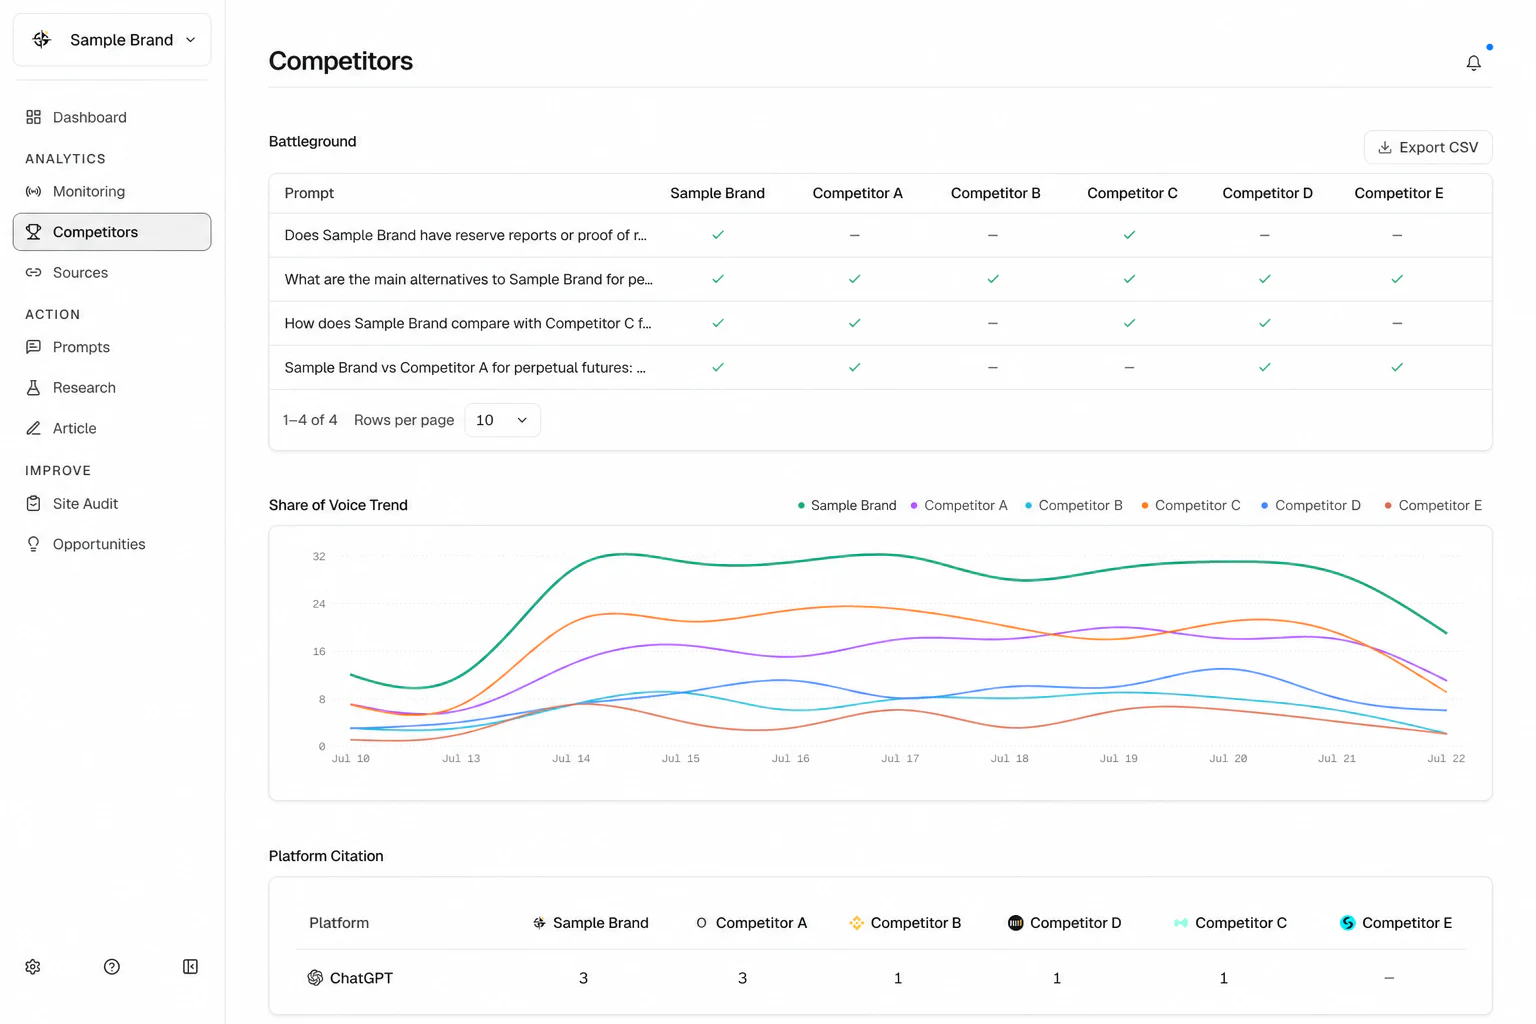
Share of voice = your brand-mentioning answers ÷ all appearances of your brand and configured competitors.
AEO Mantis counts at the response level: each entity can add at most one appearance per answer. If one answer mentions you and two competitors, it contributes one count to each entity. That means share of voice is a share of tracked entity appearances, not an exclusive market share of answers.
Example: your brand appears in 12 answers. Configured competitors account for 18 appearances across the same qualified answer set. Your share of voice is 12 ÷ 30 = 40%.
Share of voice answers: “When AI discusses this category, how much of the tracked conversation belongs to us?” It is unavailable until competitors are configured, and it changes when the competitor set changes. Record that scope in reports.
This metric prevents a common false victory. Your mention rate can increase while share of voice falls because competitors are improving faster. When that happens, break the data down by topic and inspect the battleground prompts where competitors appear and you do not.
Avoid two mistakes:
- Do not compare a three-competitor SOV baseline with a later six-competitor baseline as if the denominator stayed fixed.
- Do not assume a high SOV means buyers receive a strong recommendation. Sentiment and answer-level status still matter.
4. Sentiment measures framing
Sentiment is the distribution of positive, neutral, and negative classifications among qualified answers that visibly mention your brand. If 8 answers mention you and 5 are positive, 2 neutral, and 1 negative, the distribution is 62.5% positive, 25% neutral, and 12.5% negative.
Sentiment answers: “What kind of presence are we earning?” A higher mention rate is not automatically good if the new answers emphasize limitations, poor fit, pricing concerns, or trust problems.
Use sentiment as an investigation queue, not a reputation oracle. Classification compresses a nuanced answer into a label. A neutral comparison may be commercially useful; a superficially positive sentence may still rank you behind every competitor. Open the stored response, read the excerpt around your brand, and inspect the cited sources before assigning work.
The most useful signals are:
- a new negative answer on a high-intent prompt;
- several platforms repeating the same objection;
- sentiment worsening while mention rate rises;
- one source or claim appearing repeatedly behind negative framing.
Recommendation status and position are context, not a fifth scoreboard
An answer can recommend, mention, compare, or rule out a brand. It can place the brand first, include it among several options, or bury it in a caveat. These fields explain why an overall metric moved, but they are usually too sparse and prompt-dependent to become one universal KPI.
Use them to qualify the four main metrics. If mention rate is healthy but most appearances are comparisons or weak placements, the visibility is real but not yet persuasive. If an answer rules the brand out, the presence should not be celebrated as a win.
Read combinations, not isolated cards
- Mention rate up, citation rate flat: brand presence is expanding, but your site is not gaining source slots. Check cited domains and missing citable pages first.
- Citation rate up, mention rate flat: your content is useful, but brand positioning is not expanding. Check entity/category language and recommendation status.
- Mention rate up, SOV down: competitors are growing faster. Check topic SOV and battleground prompts.
- SOV up, sentiment worsens: you appear more often, but with weaker framing. Open negative answers and inspect their sources.
- All metrics flat after publishing: the content may not match monitored demand, may not be retrievable yet, or may need distribution. Check prompt fit, indexing, sources, and per-platform results.
These combinations give hypotheses, not verdicts. The exact answers decide which hypothesis survives.
Keep comparisons honest
Before calling a trend meaningful, hold the measurement scope steady:
- Prompt set: adding easy prompts changes the denominator. Use a stable core set and annotate additions or removals.
- Platform set: compare ChatGPT with its own history and Gemini with its own history before blending them.
- Competitor set: SOV is only comparable when the tracked entities are the same.
- Metric-excluded scope: do not mix discovery-only results with a view that includes direct-brand prompts.
- Time window: a 7-day view answers “what changed recently?”; a complete 28-day view is more useful for judging direction.
- Unit: a move from 20% to 30% is up 10 percentage points, not 10%.
AI answers vary between runs. One check is evidence, not a trend. Look for repeated movement across scheduled runs, then confirm it at the prompt and answer level.
Use 7-day and 28-day views for different decisions
The 7-day view is an operating signal. Use it to find failed checks, newly missing citations, sudden negative answers, and prompts that deserve inspection. Small samples can move sharply, so label the number of qualified answers and do not call one weekly swing a trend.
The 28-day view is the performance view. Compare complete periods with the same core prompts, platforms, competitor set, and exclusions. If the 28-day metric moves, open the 7-day slices to learn when the change started and which answers caused it.
- 7 days: use for triage, QA, and choosing the next prompt or page to inspect. Do not declare a durable gain from a handful of answers.
- 28 days: use for direction, platform comparison, and prioritizing content work. Do not let the longer average hide a recent break.
Keep external analytics windows separate. A delayed or incomplete Search Console period, a live AI-monitoring run, and a third-party keyword snapshot are different evidence sets; combining them into one trend creates false precision.
When a citation metric reveals a gap, the AI citation analysis guide shows how to inspect the exact pages, check claim support, and assign the next content action.
- A metric is only comparable when its prompt, platform, competitor, and exclusion scope are comparable.
- Mention rate measures presence; citation rate measures whether your domain earned attribution.
- Share of voice counts tracked entity appearances, so one answer can count for multiple brands.
- Every percentage should remain traceable to the prompts, answers, and sources that produced it.
A practical reporting hierarchy
For a weekly review, four questions are enough:
- Are we present? Lead with mention rate by topic and platform.
- Are we a source? Use citation rate and the pages or domains behind it.
- Are we winning the category? Use SOV against a fixed competitor set.
- Is the visibility helping? Use sentiment, recommendation status, and answer excerpts.
Then choose one action tied to the largest valuable gap: create a missing answer page, improve an existing source, clarify positioning, correct a repeated objection, or add a genuinely important buyer prompt. If the metric cannot change a decision, it does not belong in the executive summary.
The quality of the dashboard still depends on the quality of its questions. Build the set first with How to Find the Buyer Prompts Your Customers Ask AI, then keep a stable core so your trends remain interpretable.
For the operating loop that turns those metrics into owned actions, use the AI brand monitoring workflow.
Frequently asked questions
Use share of voice when you have a stable competitor set; it gives leadership a competitive outcome. Without competitors, use mention rate. Content teams should keep citation rate beside either one because it points to work they can execute.
They answer a different question: whether AI describes the brand accurately when asked directly. Discovery metrics ask whether the brand appears without being guaranteed a mention. Mixing the two usually inflates the headline rates.
Compare direction and gaps, but keep each platform visible and compare it with its own prior runs first. Their answers expose sources differently, so an aggregate can hide the reason a rate changed.
Keep a stable core and review it periodically. Add or retire prompts when buyer language, products, markets, or priorities change, and annotate the change so the trend is not misread.